With the fast EV transition, legacy battery manufacturers whose practices have stayed largely the same for 30 or more years are building new factories to scale with demand, making massive investments often far from home. In this era of IoT connectivity, that can produce information overload if the operations attempt to do things the same way as they have in the past. It is in their best interest to extract meaningful facts about their operations based on evidence. As we speak of faster resolutions, knowledge discovery in real time becomes a key component; one such discovery is to replace decades of tribal knowledge by identifying causal relationships and connections among data from different sources. In this blog, statistical process control (SPC) is studied and characterized based on its relationship with equipment performance sensor data through Fault Detection (FD).
Enhanced process understanding
By analyzing the relationship between SPC data (e.g., coating thickness variations in the electrode process) and equipment sensor data (e.g., coating head temperature, roller speed, vibration signature or pressure), manufacturers can gain a deeper understanding of how equipment conditions influence process outcomes.
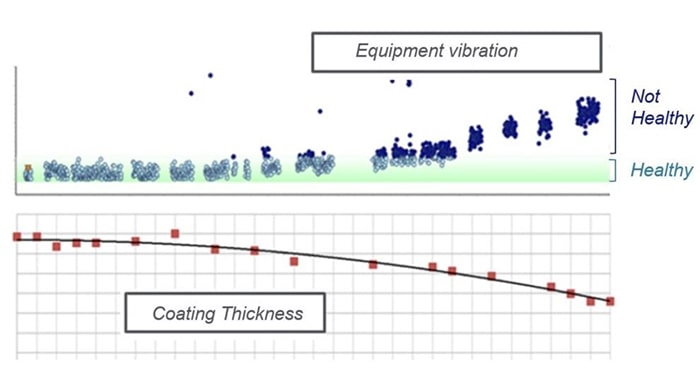
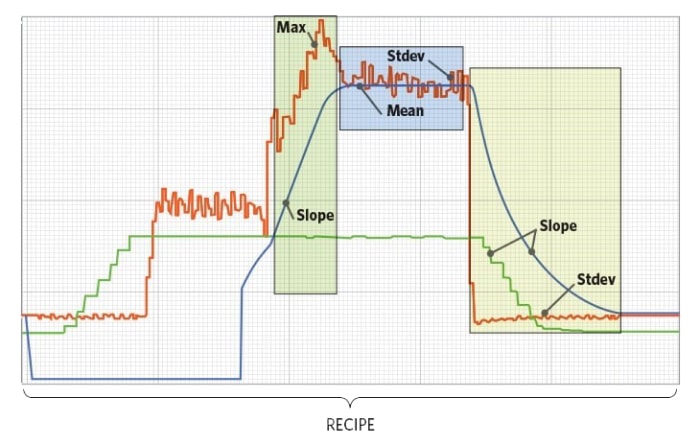
This integrated analysis can uncover hidden correlations that might not be apparent when examining individual data streams in isolation. For example, subtle changes in equipment vibration might correlate with increasing coating thickness variations, as shown in figure 1 below. With fault detection, meanwhile, we typically set limits to monitor alarms and understand how a system runs under nominal conditions for a given recipe. However, variation within univariate analysis (UVA) limits is meaningful to the strategy of correlating sight measurements with sensor data. While the ability to assign a diagnosis in real time can be achieved using an automated system, a human would be hard-pressed to identify and mitigate risk to electrodes quickly enough.
Improved process control
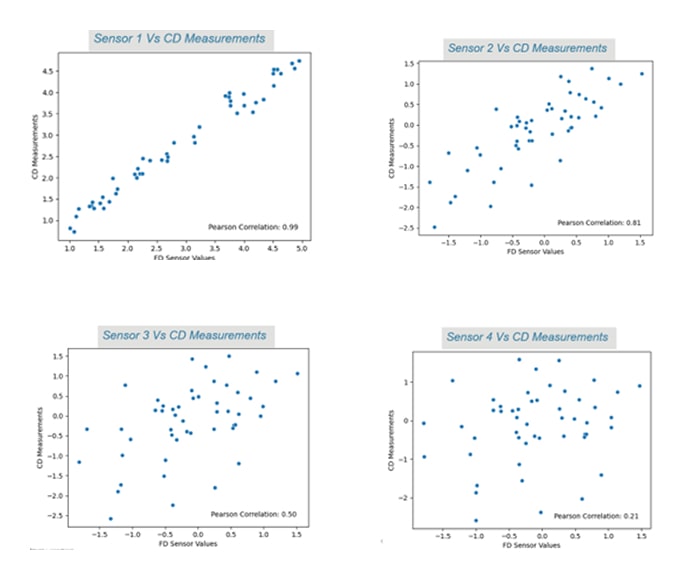
By continuously monitoring SPC data alongside equipment sensor data, as shown in figure 2, process engineers or automation systems can make real-time adjustments to equipment settings and process parameters to maintain optimal performance and minimize variations.
Additionally, if they proactively address equipment-related issues that impact product quality, manufacturers can significantly reduce scrap rates and improve overall yield.
Data-driven decision making
The integrated data provides a more comprehensive view of the manufacturing process, enabling data-driven decisions regarding equipment maintenance, process optimization, and overall production strategy.
Example
Predictive maintenance
Equipment sensor data (temperature, vibration, pressure, current draw, etc.) often shows subtle changes before a major failure occurs. For experienced manufacturers, this shows up as tribal knowledge in the teams who have worked on the shop floor for decades. As these companies scale production, build new factories, and hire new workers (often oceans away from home), they are challenged to replace that tribal knowledge in the new facilities. By overlaying this data with SPC data, manufacturers can identify early warning signs of impending equipment issues and run their new factories with the same or better yields than their home-based operations.
Predictive maintenance allows for proactive maintenance scheduling, minimizing unplanned downtime and maximizing equipment utilization. By addressing potential issues before they escalate, manufacturers can extend the lifespan of their equipment and reduce maintenance costs.
Conclusion
As battery manufacturing continues to advance, the role of SPC and FD correlation analysis will only become more important. Manufacturers embracing this integrated approach are poised to stay ahead of the curve, meeting the demands of today’s EV market with confidence and agility.
SmartFactory Process Control explicitly exposes the behavior of manufacturing tools and processes for customized, continuous, and automated adjustments. This enables battery manufacturers to achieve high quality standards, at higher roll speeds and efficiency. SmartFactory is committed to delivering best-in-class practices developed in the semiconductor industry to battery manufacturers with a focus on maximizing production yields and efficiency.
About the Authors

Agnes is the segment manager overseeing battery manufacturing and strategic alliances. Prior to joining Applied Materials Automation Product Group, Agnes was Manager of Smart Factory Partnerships at Panasonic Connect, overseeing manufacturing technology implementations of productivity, automation, MES and maintenance software. She holds an M.B.A. in Finance from DePaul University, and a B.S. in Mechanical Engineering from Illinois Institute of Technology in Chicago.

Vishali has been working in the semiconductor industry for more than 15 years. Prior to joining Applied Materials, she worked at Micron Technology, first as a process engineer and then as a senior quality engineer. She has been with Applied for seven years, having joined the company as a quality solutions architect. Vishali is currently a Global Product Manager overseeing SmartFactory SPC3D, an advanced process control (APC) engine that runs statistics to determine if processes are within spec to improve product yield. Vishali has an MS in mechanical engineering from Oklahoma State University, and a bachelor’s in mechanical engineering from Osmania University, in Hyderabad, Telangana, India.