• Subscribe

Synergizing Fault Detection and SPC: smarter manufacturing solution for cost reduction

Integrating the functions of Statistical Process Control (SPC) and Fault Detection (FD) helps semiconductor manufacturers achieve higher quality, reliability, and efficiency
In the intricate world of semiconductor manufacturing, precision is not just a preference; it is an absolute necessity. The smallest deviation can lead to significant defects impacting the final product’s quality and yield. To meet the demands of ever-shrinking device sizes and increasing complexity, manufacturers rely on advanced tools and methodologies. Two such essential tools are Statistical Process Control (SPC) and Fault Detection (FD) systems. While both offer distinct advantages on their own, integrating them into a unified platform provides a range of benefits that can significantly enhance semiconductor manufacturing process techniques. SmartFactory SPC3D® is increasingly sophisticated at building models, especially when correlating fault detection data with inline measurements.

Understanding SPC - FD systems integration

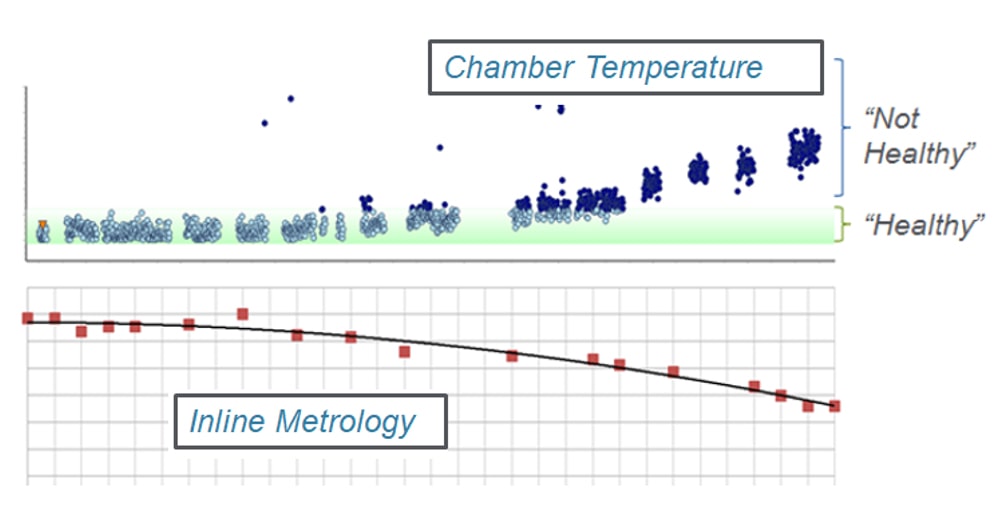
Having SPC and FD systems integrated into one platform provides a comprehensive view of the entire manufacturing process. Operators and engineers can monitor the process variables controlled by SPC and detect any faults or anomalies identified by the FD system. When SPC and FD data are integrated, it becomes easier to correlate process variations with potential faults and gain a deeper understanding of these relationships. This holistic view leads to more informed decision-making.

Such integration also streamlines data management, providing a centralized repository for all process-related information. By minimizing defects, optimizing processes, and reducing downtime, the integrated SPC-FD system leads to significant cost savings. Improved yield means more usable chips per production run, translating to higher revenues.

Correlating equipment data with inline measurements

One of the advanced applications of SPC in semiconductor manufacturing involves correlating equipment data with inline measurements. This correlation provides insights into how equipment performance impacts product quality. It examines how anomalies detected by the FD system correspond to specific process parameters monitored by the SPC system. For example, a spike in voltage fluctuations (detected by FD) correlates with a specific tool’s running parameters (monitored by SPC), indicating a potential equipment issue. Figure 1 shows another example, the relationships between chamber temperature and metrology.
Figure 1: Interrelationship between equipment temperature and the inline measurements showing inverse correlation.

There are many types of correlations that detect deviations from expected behavior early in the manufacturing process. Such connections optimize processes by adjusting parameters to reduce defects and improve efficiency. One such example is the Pearson Correlation Coefficient, which is a valuable tool for quantifying the strength and direction of this relationship.

The Pearson Correlation Coefficient

The Pearson Correlation Coefficient, often denoted as ‘r’, measures the linear relationship between two variables, X and Y. It ranges from -1 to 1, where:

  • 1 indicates a perfect positive linear relationship.
  • -1 indicates a perfect negative linear relationship.
  • 0 indicates no linear relationship.

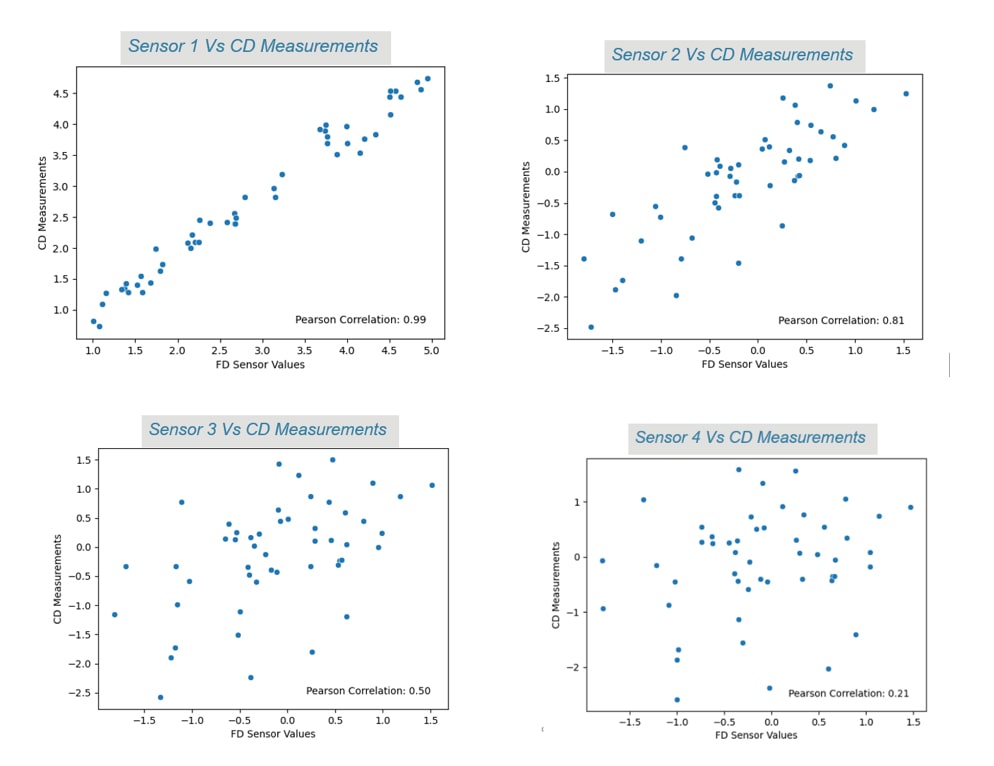
Figure 2 shows the behavior of different equipment sensors when measured in terms of immediate product measurements. As noticed, Sensor 1 shows a linear relationship and tells us there is significant effect on product dimensions. A coefficient of 0.99 indicates a positive correlation and it can guide us with root cause analysis when unexpected behaviors surface.

Figure 2: Fault Detection sensors correlations with SPC inline measurements with calculated Pearson Coefficient

Implementing SPC with correlation analysis

SmartFactory SPC3D focuses on the ease with which such analytical models can be implemented. The platform provides the ecosystem for data preparation, model selection and implementation, which readily works with existing data. Among the key capabilities of this application are user experience and interpretation of results for easier implementation into factory systems. Web-based reporting helps ensure continuous monitoring and maintenance of the model’s performance. One of the advantages of this solution is that it helps shut down tools likely to produce bad products, as well as qualify new tools and validate preventative maintenance (PM) cycles. With many of our customers, we have seen smoothened tool performances for KPI improvements as well as process window gains for better line monitoring and scrap reduction.

Conclusion

In the competitive landscape of semiconductor production, where precision and efficiency are critical, having SPC and FD capabilities in one place provides a comprehensive approach to process management. It is not just about producing chips; it is about producing them with the highest quality, reliability, and efficiency possible.

As semiconductor technologies continue to advance, the role of SPC and correlation analysis will only grow in importance. Manufacturers embracing this integrated approach are poised to stay ahead of the curve, meeting the demands of today’s semiconductor market with confidence and agility. Applied SmartFactory is committed to delivering best in class practices to semiconductor manufacturers to help them achieve their standards for quality and efficiency.

FAQs

What is Statistical Process Control (SPC)?

SPC is the process by which various data points are collected for each step of the manufacturing process, making it possible to determine whether a given step was completed correctly.

Fault detection collects and analyzes equipment parameters to provide rapid feedback on process performance issues and avoid unexpected failures that decrease productivity.

Integrating SPC and FD so they are in one place streamlines data management and provides a centralized repository for all process-related information. The integrated system minimizes defects, optimizes processes, and reduces downtime, which leads to significant cost savings.

About the Author

Picture of Vishali Ragam, Global Product Manager, SPC
Vishali Ragam, Global Product Manager, SPC
Vishali has been working in the semiconductor industry for more than 15 years. Prior to joining Applied Materials, she worked at Micron Technology, first as a process engineer and then as a senior quality engineer. She has been with Applied for seven years, having joined the company as a quality solutions architect. Vishali is currently a Global Product Manager overseeing SmartFactory SPC3D, an advanced process control (APC) engine that runs statistics to determine if processes are within spec to improve product yield. Vishali has an MS in mechanical engineering from Oklahoma State University, and a bachelor’s in mechanical engineering from Osmania University, in Hyderabad, Telangana, India.