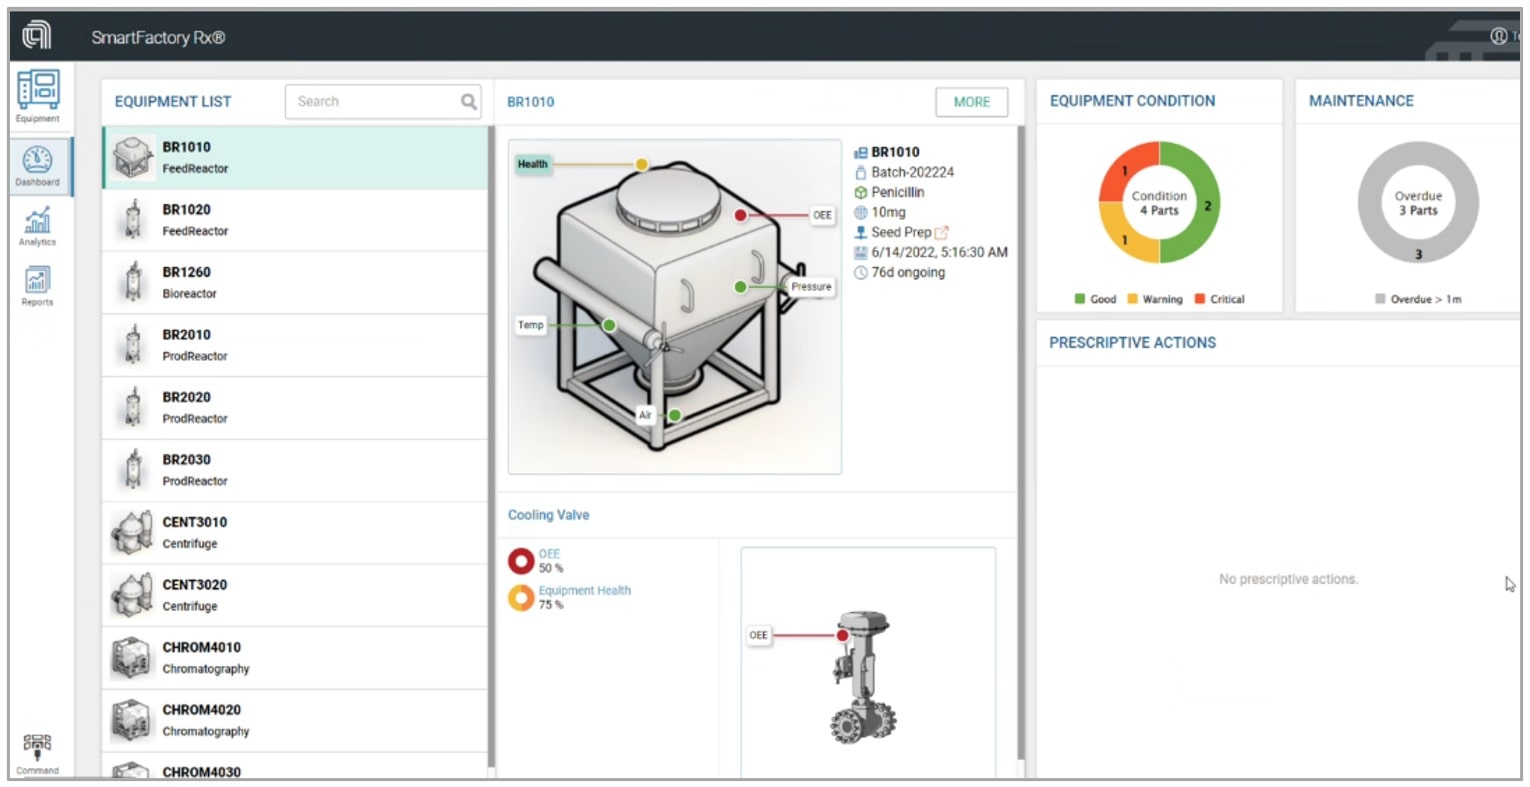
In Part 1 and Part 2 of the data scientist conundrum series, we briefly discussed the tasks of data aggregation and preprocessing and data transformation to identify the key features and patterns in the data. In this article, part 3 of our series, we will briefly examine how SmartFactory Rx® helps data scientists choose and create the right model for the process and helps them visualize that process (Figure 1).
- Reduce process variability and scrap
- Improve productivity
- Reduce cost and unscheduled equipment downtime
- Make real-time decisions on the manufacturing floor and react to process changes
The overwhelming majority of manufacturing sites have rudimentary SPC that follows Univariate Analysis (UVA) to monitor key properties of the product. SmartFactory Rx effortlessly provides the capability to monitor any real or virtual variables. Algebraic expressions can be written based on observed parameters and then treated as variables themselves (virtual sensors). There is flexibility in treating brand new or mature processes: limits around the variables can be adaptive based on user defined rules e.g., Exponentially Weighted Moving Average (EWMA), based on the standard deviation of the parameter, or simply expressed as % deviation around a target value.
Multivariate Analysis (MVA) adds another layer of knowledge and analytics power. The user can define the data to be modeled and the application will take care of the training and model creation, as well as the precision of the created model versus incoming subsequent production data. The next key component is supervised modeling. Batch sampling or metrology results can be ingested as they become available and lead to an improvement in model accuracy.
As discussed in previous blogs, the models can be hybrid – marrying the convenience of statistical modeling with the accuracy of first principles based modeling – by allowing the inclusion of virtual sensors tied to the process being monitored. In addition to the UVA and MVA modeling capability, the code-savvy user can integrate their own python script in the SmartFactory Rx modeling arsenal. The models are able to calculate process health metrics based on the process parameters.
The subsequent health metrics are plotted against time for the duration of the process and the operator on the manufacturing floor has a clear understanding of whether the process is deviating, or not, from the expected optimal behavior (Figure 2).


