Wouldn’t it be nice to see your whole pharmaceutical manufacturing site from a bird’s eye view? What if you could manage each process and piece of equipment as if you were an air traffic controller looking at every plane in the sky? This scenario is closer to reality than you think.
While pharma manufacturing equipment doesn’t fly away, it can feel like you travel thousands of miles to gather and wrangle data to discover, diagnose and solve problems related to equipment and processes. Each data system in the facility is adept at collecting and storing valuable information, but that information normally exists in its own silo and often lands in a data graveyard. It’s difficult for operators to get actionable insights if they can’t look at the full picture of what’s going on.
To put data and analytics into a usable context, you don’t need to replace all the systems that collect and analyze data. Instead, leading pharmaceutical companies are aggregating that data and analytics into a single unified dashboard called a ‘control tower.’ Control towers create a single real-time view of every process and piece of equipment on a single screen. Specifically designed to break down data silos, these systems leverage existing analytics systems but unify those disparate models into a single unified view of the plant. The main need for a control tower in pharma is to help operators manage the barrage of data, analysis and alerts they see on the shop floor.
The control tower developed as part of SmartFactory Rx® places all that information in an intuitive dashboard. This system aggregates information about maintenance, state of equipment, process, and other KPIs but still allows ‘drill downs’ to see that information when it’s needed. By allowing operators to interact with a single, easy-to-use interface, control towers drive connectivity between different systems in the plant. They give supervisors the insight needed to direct everything at a high level and operators the specific information they need to make decisions on the spot. User groups can be created to designate who receives specific alerts or other information, with different levels of permission to see data.
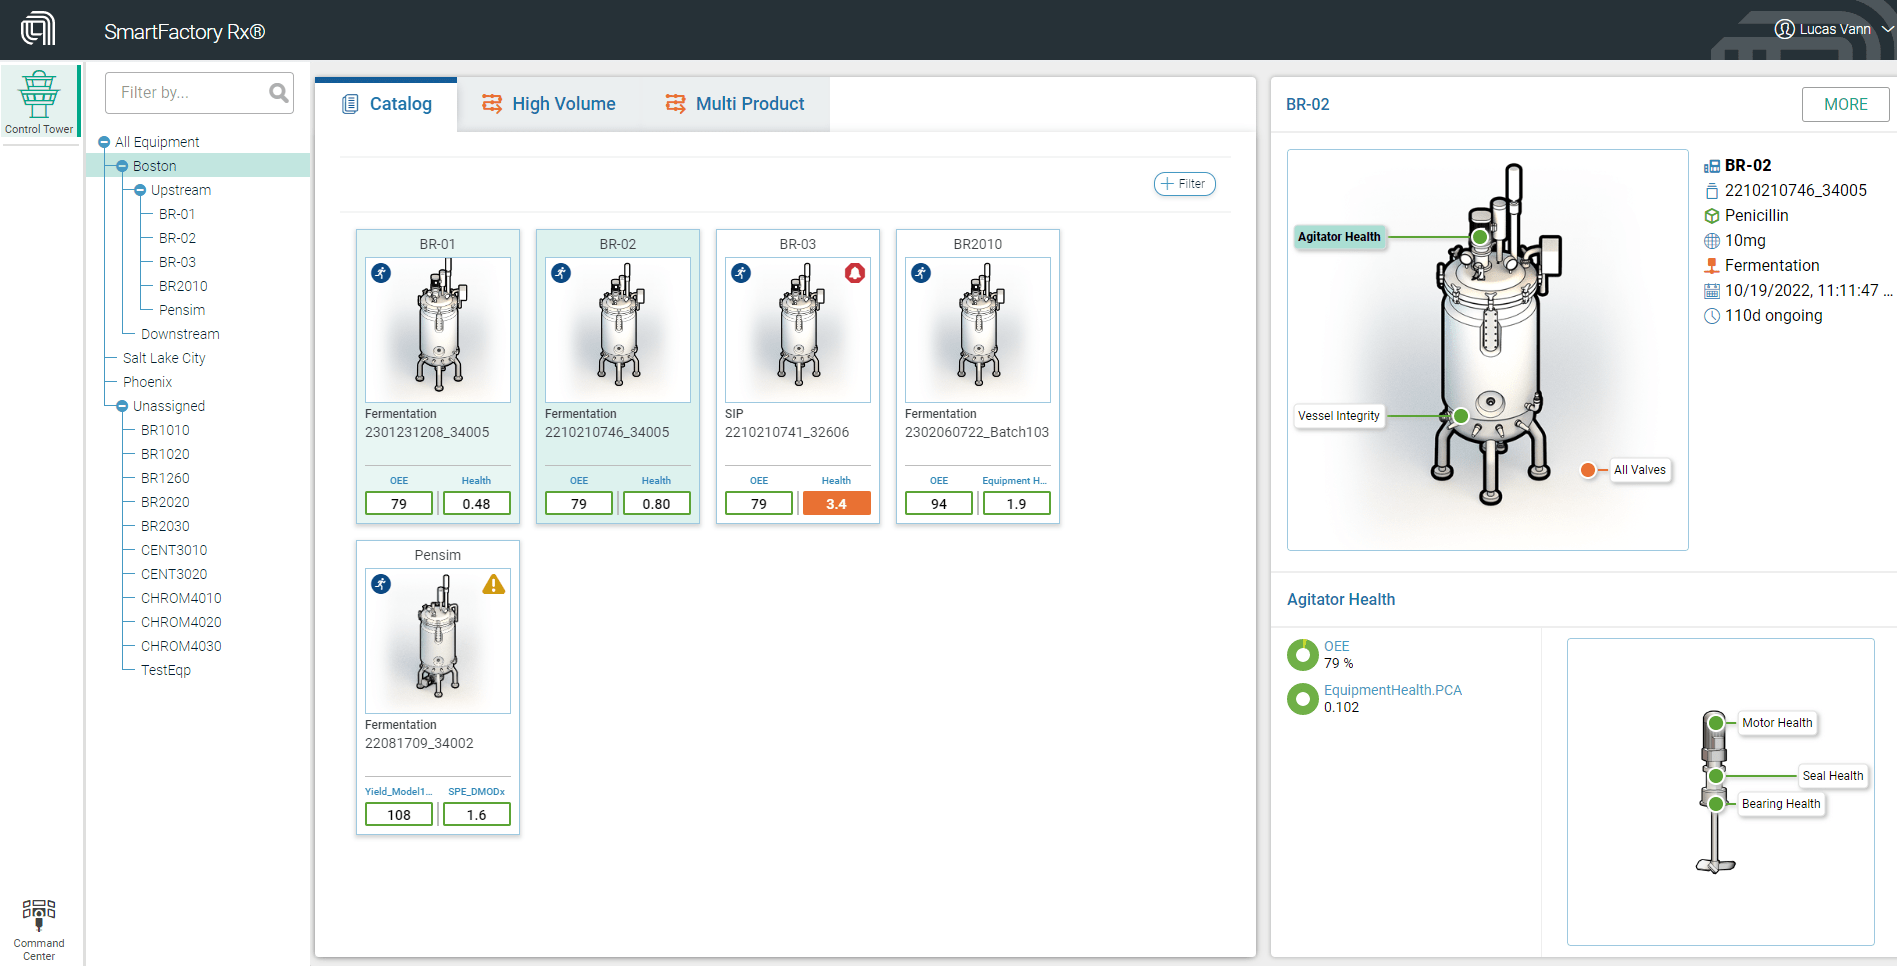
From one location, supervisors and technicians can see what’s happening on the floor, across the site, or across multiple sites in real-time. For example, with an interactive image that shows you each piece of equipment and an easily recognizable green-amber-red key to depict status, you can quickly see which machines have alerts or alarms (see figure 1, below). With a few clicks, you can determine which part or parts are having trouble, when maintenance was last performed and, if you choose to, act based on a set of built-in work instructions to resolve the issue. This high line of sight approach helps identify issues faster and saves time identifying and solving them. It also helps managers move from a reactive state to a proactive one. Rather than finding a problem after gathering and crunching data from multiple sources, SmartFactory Rx Control Tower can be programmed to monitor status and recommend actions to increase yield, maximize the lifespan of parts, or improve efficiency of a batch by better scheduling operations and maintenance, just to name a few examples.
The SmartFactory Rx Control Tower dashboard will be configured to display what you define as most meaningful and intuitive for your needs. Choose which types of equipment and process steps you want to see, what type of image is displayed and what metrics and KPIs are shown, such as overall equipment effectiveness and a multivariate model for “health” of equipment.
A machine learning (ML) model runs the analytics that connect sub-systems for equipment, process and quality. The ML constantly rebuilds its model to add new data, then compares the new model to the existing. If the challenger model is performing better than the original, you will get an alert suggesting you change the challenger model to the designated model, but the decision ultimately is up to you.
SmartFactory Rx’s Control Tower helps bring data from different areas that don’t communicate well with each other, such as bioreactors, harvest and purification, into one place—where you need the information. And, by providing a clear carryover of information and analytics from shift-to-shift, it’s like always having your best operator on site monitoring the process via algorithms and recommendations.
Armed with contextualized data, the moment you need it, you can move to greater productivity, efficiency, and improved yield.


