
What’s Inside
- The challenge: moving beyond experience-based spec settings
- The solution: SmartFactory AI™ Predictive Metrology with Safe Zone Simulator
- Advanced capabilities: process simulation and explainability
- Results: exceptional model performance
- The bigger picture: toward unified process control
- Predictive Metrology: an early proof point
- Key takeaways
- Looking ahead
The challenge: moving beyond experience-based spec settings
For semiconductor manufacturers, maintaining tight process control while minimizing production disruptions is a constant balancing act. A leading memory IC manufacturer faced a common yet critical challenge in their dry etch operations: their univariate analysis (UVA) specifications were set based on expert experience and legacy configurations.
This approach led to significant operational pain points:
- Excessive false alarms: UVA specs frequently triggered alerts that didn’t correspond to actual quality issues, overwhelming module engineers with unnecessary alarm handling workload.
- Missed quality issues: Despite the abundance of alarms, real yield issues sometimes went undetected because UVA specifications couldn’t capture the actual process-to-quality relationships.
- Inefficient resource allocation: Engineers spent valuable time investigating false positives instead of focusing on genuine process improvements.
The customer needed a smarter approach—one that could leverage their wealth of historical data to establish scientifically-grounded process limits.
The solution: SmartFactory AI™ Predictive Metrology with Safe Zone Simulator
1. Data-driven model building
The team collected comprehensive process data from the customer’s dry etch tools, including:
- UVA and trace data from the etch process.
- Lot quality control metrology measurements (depth/CD at 13 sites per wafer).
- Both production wafers and experimental lots from preventive maintenance (PM) periods.
A key insight emerged during the project: initial models built only on steady-state production wafers showed limited variation. By incorporating experimental wafers from the unstable post-PM period where module engineers actively tuned process parameters, the models could capture a much wider range of UVA-to-LQC relationships.
2. Intelligent Feature Ranking
Using Partial Least Squares regression, the solution identified the most critical UVA parameters affecting metrology outcomes. The analysis revealed that a small set of equipment- and process-related parameters dominated the top key features, giving the team a clear, ranked shortlist of what to monitor.
This finding provided actionable intelligence for the dry etch engineering team, confirming which process parameters required the most careful monitoring and control.
3. Safe Zone Simulator
The breakthrough capability: Given desired metrology control limits (Y specifications), the system could reverse-engineer optimal UVA specifications (X limits) that would keep the process within spec (see Figure 1).
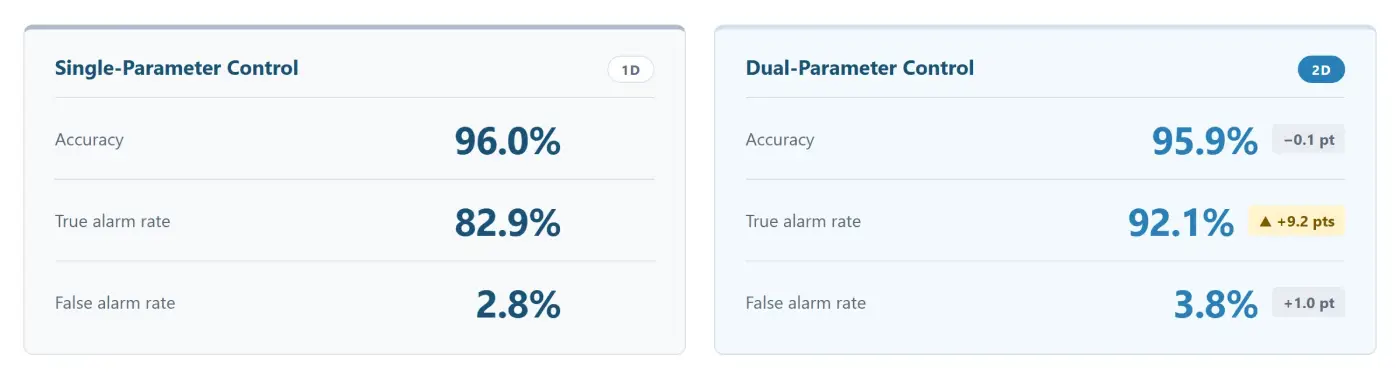
The system provides intuitive visualizations showing safe operating zones. This enables engineers to understand the complex interactions between multiple process parameters and their impact on metrology outcomes.
Advanced capabilities: process simulation and explainability
Beyond spec recommendation, the solution delivered powerful simulation and diagnostic tools, including:
Process simulator: Engineers can now explore “what-if” scenarios by adjusting key feature values and instantly seeing predicted metrology outcomes. For example, adjusting a wafer’s top-ranked feature shows the predicted LQC shift in real-time—enabling proactive process optimization before running actual wafers.
SHAP-based explainability: Using Shapley Additive Explanations (SHAP), the system provides transparent explanations for model predictions. When engineers noticed two wafers with identical primary parameter values producing different metrology predictions, the SHAP analysis immediately identified differences in secondary parameters as the root cause.
This explainability builds trust in the AI recommendations and helps engineers deepen their process understanding.
Results: exceptional model performance
The Virtual Metrology model achieved outstanding accuracy, validated by the customer’s process engineers as “very good”:
- 0.2% MAPE
- 901 wafers analyzed
- 6-month data period
This level of prediction accuracy enables confident decision-making for spec optimization, allowing engineers to trust the AI-recommended safe zones.
The bigger picture: toward unified process control
For decades, the pillars of advanced process control have operated as separate systems: Fault Detection and Classification (FDC), Run-to-Run and Advanced Process Controls (R2R and APC), and Statistical Process Control (SPC). Each is powerful, but works largely in its own silo.
Applied Materials’ vision is to change that. Rather than adding yet another standalone tool, we are building a new generation of AI solutions on top of the FDC, R2R/APC, and SPC systems that fabs already rely on. These solutions draw on data from across all three domains and feed intelligence back into each—augmenting the existing investment rather than replacing it. The result is process control that behaves as one connected, continuously learning system instead of a set of disconnected point tools.
Predictive Metrology: an early proof point
The Safe Zone Simulator story above is a clear example of the vision in action. The solution learned from fault-detection-domain data (UVA and trace signals), related it to downstream metrology outcomes, and produced data-driven control limits of the kind traditionally managed in SPC—all to protect yield in a way no single system could achieve on its own. It did not replace the fab’s existing FDC or SPC; it connected and elevated them with an AI layer on top.
That is the pattern we intend to repeat across the portfolio: AI that unifies fault detection, run-to-run control, and statistical process control into a single, continuously improving loop—turning years of siloed process-control data into predictive, actionable intelligence.
Key takeaways
This collaboration demonstrates the power of data-driven process control:
- From experience to evidence: UVA specifications can be scientifically determined rather than empirically guessed
- Multi-dimensional optimization: Considering parameter interactions (2D+ analysis) significantly improves alarm effectiveness
- Continuous improvement: The system requires periodic retraining with new data to maintain prediction accuracy—a sustainable approach to ever-improving process control
- Actionable intelligence: Beyond recommendations, the solution provides simulation and explainability tools that empower engineers to understand and trust the AI
- Unified, not siloed: The biggest gains come when AI draws on FDC, R2R/APC, and SPC together, augmenting every system rather than adding another standalone tool
Looking ahead
As semiconductor manufacturing complexity continues to grow, AI-driven solutions like the Safe Zone Simulator represent the future of Advanced Process Control. By transforming historical data into predictive intelligence, fabs can achieve the dual goals of tighter quality control and reduced operational burden.
For this customer’s dry etch operations, the proof-of-concept has laid the groundwork for a new paradigm in process control excellence.
This success story is based on a Proof-of-Concept project conducted by Applied Materials’ Automation Products Group in partnership with a leading memory semiconductor manufacturer.
FAQs
How can we reduce false alarms without missing real process problems?
AI-driven predictive metrology can help by using historical process and metrology data to set more accurate control limits. Instead of relying only on experience-based thresholds, the model identifies which process signals are most tied to quality outcomes, helping engineers reduce unnecessary alarms while still detecting conditions that could affect yield.
Can AI help us set better UVA specifications for dry etch tools?
Yes. By learning the relationship between equipment signals, process parameters, and downstream metrology results, an AI model can recommend UVA limits that are better aligned with actual quality requirements. This gives process teams a data-supported way to refine specifications and avoid overly broad or overly sensitive limits.
What is a “safe zone” in semiconductor process control?
A safe zone is the operating range where key process parameters are expected to keep wafer metrology results within target limits. With a simulator, engineers can visualize how one or more parameters interact, test different operating conditions, and identify the process window most likely to protect quality before wafers move further through production.
How do we know whether we can trust the AI model’s recommendations?
Trust comes from both model performance and explainability. Predictive accuracy shows whether the model can reliably estimate metrology outcomes, while explainability tools help engineers see which parameters influenced a prediction. This makes AI recommendations easier to validate, interpret, and use in day-to-day process decisions.
Can predictive metrology work with the process control systems we already use?
Predictive metrology is designed to complement existing FDC, APC/R2R, and SPC systems. It can use data from these systems to generate earlier quality predictions, improve control-limit decisions, and support a more connected approach to process control without requiring fabs to replace their established infrastructure.